← Beniamin

Project · 2026 · Python

AI Stock Watcher

A program that reads a week of a small stock market, asks a language model what changed, and leaves a PDF on the desk. Then checks itself the week after.

What it is

Three exchange-traded funds listed in Bucharest hold 44 positions between them, across 26 companies — several of the larger names are held by more than one fund. Following those companies by hand means opening the exchange site, the filings page and a price chart for each one, every week.

This does that instead. It collects the week, writes a report for each fund, and saves it as a PDF. A second list follows the ten largest Bucharest-listed companies that sit outside the three funds.

The part that makes it unusual is at the end. Each report closes with specific expectations for the following week, and the next run opens the previous report before writing anything and says whether they held. An expectation that cannot turn out wrong cannot be checked either, so they have to be concrete.

How it runs

Five stages run in order, from re-reading which companies are in the funds to writing the PDF. Nothing is typed and nothing is clicked; what triggers the run, and what happens when it fails, is further down.

OUTSIDE WORLD bvb.ro /indices what each ETF holds Yahoo Finance · prices bvb.ro · official filings news RSS · fallback Brent · EUR/RON 00 Refresh Index membership changes. Never hardcode a portfolio. 01 Collect 10 workers 1 cached fetch 2 retries 02 Compare What moved since the last report — not since Monday. 03 Reason Claude Opus, once a week. Grounded in the data given. 04 Render Markdown straight to PDF. No browser, no extra runtime. MEMORY ON DISK etf_holdings.json who is in the index previous_week_data.json last week's prices previous_analysis.md last week's calls read back next Friday, to be graded ETF_Report.pdf on the desk

Five stages, one command, no server. Each stage degrades rather than stops — a thinner report is still a report.

00

Refresh — who is actually in the funds

Index membership changes. Hardcoding the 44 positions means the report silently describes last year’s portfolio, so the holdings are re-scraped from the exchange each run and written to etf_holdings.json.

The exchange refused to serve the scraper, and changing the User-Agent header made no difference — the requests were being dropped before any header was read.

Every HTTPS connection opens with a handshake, and the exact way a client proposes its ciphers and extensions differs between tools. That pattern is consistent enough to identify the software making the request: Chrome has one, Firefox has another, and Python’s requests library has one that no browser produces. The exchange was matching on it and closing the connection.

curl_cffi performs the handshake the way Chrome does, so the connection looks like a browser from the first packet. Everything above that layer — the URL, the headers, the parsing — stayed exactly the same.

from curl_cffi import requests

response = requests.get(
    url, headers=self.headers, timeout=self.timeout, impersonate="chrome"
)

01

Collect — twenty-six symbols without waiting for each one

Prices, filings and news are fetched once per company rather than once per position, so 44 holdings cost 26 requests. Done one after another this is dominated by network latency, so they run in a thread pool — ten workers for prices, five for news, results collected as they land.

with ThreadPoolExecutor(max_workers=self.price_workers) as executor:
    futures = {executor.submit(self._fetch_single_price, symbol): symbol
               for symbol in symbols}

    for future in as_completed(futures):
        symbol, price_data = future.result()

02

Compare — against the last report, not against Monday

“This week” is defined as since the last report that was actually written. A rolling five-day window looks equivalent and is not: if a Friday is missed, a five-day window quietly drops the gap, and the next report describes a week that never happened. The previous run’s prices are stored in previous_week_data.json and used as the baseline.

def get_baseline_prices(self) -> Dict:
    """Prices from the last successful run, so 'weekly change' means
    'since the last report' instead of a rolling 5-trading-day window."""

# ...and, in _stock_changed():

price_pct_change = abs(curr_price - prev_price) / prev_price * 100

if price_pct_change > 0.1:
    changes['price'] = {
        'previous': prev_price,
        'current': curr_price,
        'change_pct': price_pct_change
    }

03

Reason — the only stage with a model in it

One request to the Claude API, with the analyst framework as the system prompt and the week’s data as the user message. This is what that user message looks like — built from the delta, so unchanged positions never reach the model at all.

REPORT DATE: Friday, 14 November 2026
==================================================

MACRO
  Brent crude: 95.84 USD (+3.53%)
  EUR/RON: +0.21%  USD/RON: +1.81%

WEEKLY CHANGES
--------------------------------------------------
7 of 44 positions changed; 12 new news items

TVBETETF - changed stocks:

BRD - BRD-GROUPE SOCIETE GENERALE S.A.: 33.10 RON (+4.21%)
    [BVB] 2026-11-12 - Raport trimestrial Q3 2026
    [News] 2026-11-13 - BRD posts higher net profit on lending growth

SNP - OMV PETROM S.A.: 0.7140 RON (+1.85%)
    (no news this week)

LAST WEEK'S ANALYST OUTLOOK (review these predictions in section 3, Last Week Review)
--------------------------------------------------
Base case: -1% to +1%. Oil-driven setback, not a market breakdown.
GIBEFETF preferred for bank cushion. Froth (RRC/PTR) keeps unwinding.

Rebuilt from the formatter with that week’s real figures, and abridged: a full briefing carries every changed position, the ten screened radar stocks, and last week’s outlook in full. This stage is taken apart in full immediately after the walkthrough — it is the only one that needs it.

04

Render — Markdown straight to PDF

The model returns Markdown. reportlab draws it into a PDF directly, with no browser and no headless Chrome in the pipeline, and the file is written to reports/ETF_Report_YYYYMMDD.pdf.

03 Reason · where the AI is

Built while working through Anthropic’s Building with the Claude API course. The vocabulary below is that course’s.

SYSTEM PROMPT · TRUE EVERY WEEK ETF holdings database built from etf_holdings.json · 3 funds, 44 holdings Analyst framework role — senior equity research analyst reader context — holds units; explain every term GROUNDING RULES provided data is the only source of truth · never invent output format — Markdown, tables, no code blocks structure — 11 numbered sections, word limits USER MESSAGE · TRUE ONLY THIS WEEK REPORT DATE: Friday, 14 November 2026 MACRO Brent +3.53% · EUR/RON +0.21% WEEKLY CHANGES 7 of 44 positions changed BRD: 33.10 RON (+4.21%) [BVB] Raport trimestrial Q3 2026 MARKET RADAR 10 screened stocks outside the funds LAST WEEK’S ANALYST OUTLOOK to be reviewed in section 3 client.messages.create( ) opus · thinking: adaptive · effort: medium · max_tokens: 16000 Markdown ETF_Report.pdf rendered, then copied to iCloud previous_analysis.md this week’s predictions, stored read back next Friday

Two content blocks of standing instruction, one block of this week’s data, one request. The dashed line is the only thing carrying state between runs.

One call to the Messages API, once a week

Stage 03 is the only place a model is involved. Everything before it is scraping and arithmetic; everything after it is typesetting. The call is made with the anthropic Python SDK.

system = [
    {"type": "text", "text": self.build_holdings_context()},
    {"type": "text", "text": self.build_analysis_framework()},
]

message = self.client.messages.create(
    model=self.model,                       # claude-opus-4-8
    max_tokens=self.max_tokens,             # 16000
    thinking={"type": "adaptive"},
    output_config={"effort": "medium"},
    system=system,
    messages=[{"role": "user", "content": briefing}],
)

System prompt and user message do different jobs

The system prompt carries what is true every week: a generated database of the three funds and their holdings, and the analyst framework — the role, who the reader is, the rules, and the exact eleven-section structure the report must follow. It is passed as two content blocks rather than one string, so the two halves stay separable.

The user message carries what is true only this week: prices, deltas, filings, macro figures, and last week’s predictions. The model never has to guess which part of its input is the brief and which part is the data.

You are a senior equity research analyst at a major investment bank
(Bloomberg, Morningstar, Goldman Sachs, JPMorgan style). Produce a professional,
highly readable weekly ETF report for investors.

READER CONTEXT
- The reader personally holds units of all three ETFs. They cannot change the
  weight of individual stocks inside an ETF, so recommendations about portfolio
  holdings must be at ETF level (buy more units / hold / reduce).
- The reader is a motivated retail investor, NOT a finance professional. Keep
  the technical depth, but EVERY TIME you use a technical term or jargon -
  e.g. buyback, rate sensitivity, structural concerns, free float, yield,
  P/E, capex - add a short
  plain-language explanation in parentheses right after it, e.g. "buyback (the
  company repurchasing its own shares, which supports the price)".

The reader context is doing real work. It rules out advice that cannot be acted on — you cannot reweight a stock inside an ETF you merely hold units of — and the jargon rule is why the report explains “buyback” every time it appears rather than once.

Grounding, because a model asked “why did this move?” will answer

Asked to explain a price move with no news to explain it, a language model will produce a fluent, plausible reason that never happened. The system prompt makes the provided data the only admissible source and gives the model an explicit way to say it does not know.

GROUNDING RULES (critical)
- Your training data is stale. Treat the prices, news and macro data provided in
  the user message as the ONLY source of truth about this week.
- Tie every "why did this move" claim to a specific provided news item or macro
  data point. If nothing provided explains a move, say plainly: "no disclosed
  news explains this move" - never invent earnings, deals, or events.
- News items are tagged [BVB] (official exchange filings - high reliability) or
  [News] (media coverage - treat as unconfirmed).

Extended thinking and effort

thinking={"type": "adaptive"} lets the model reason before it answers, and decide for itself how much of that it needs. output_config={"effort": "medium"} sets how hard it works on the answer. max_tokens is 16,000, which is a budget for a long report rather than a target.

Tokens and cost are measured, not assumed

Every response carries its own usage. The run logs input and output tokens and converts them to the actual cost of that week’s report, so the price of the thing is a number rather than a feeling.

usage = message.usage
logger.info(f"Analysis complete ({usage.input_tokens} in / {usage.output_tokens} out)")

def _calculate_cost(self, usage) -> float:
    # Claude Opus 4.8 pricing: $5.00/MTok input, $25.00/MTok output.
    return (usage.input_tokens * 5.00 + usage.output_tokens * 25.00) / 1_000_000

The API is stateless, so memory is a file

Nothing carries over between calls a week apart. Continuity is built, not inherited: each report is written to previous_analysis.md, and the next run loads it back into the user message under a heading that tells the model to review those predictions in section 3. That one file is the entire reason the report can grade itself.

PREVIOUS_ANALYSIS_FILE = 'previous_analysis.md'

prev_outlook = self._load_previous_outlook()
if prev_outlook:
    txt += ("\nLAST WEEK'S ANALYST OUTLOOK (review these predictions"
        " in section 3, Last Week Review)\n")
    txt += "-" * 50 + "\n" + prev_outlook + "\n"

The report

The report for the week ending 14 November 2026, exactly as it was delivered.
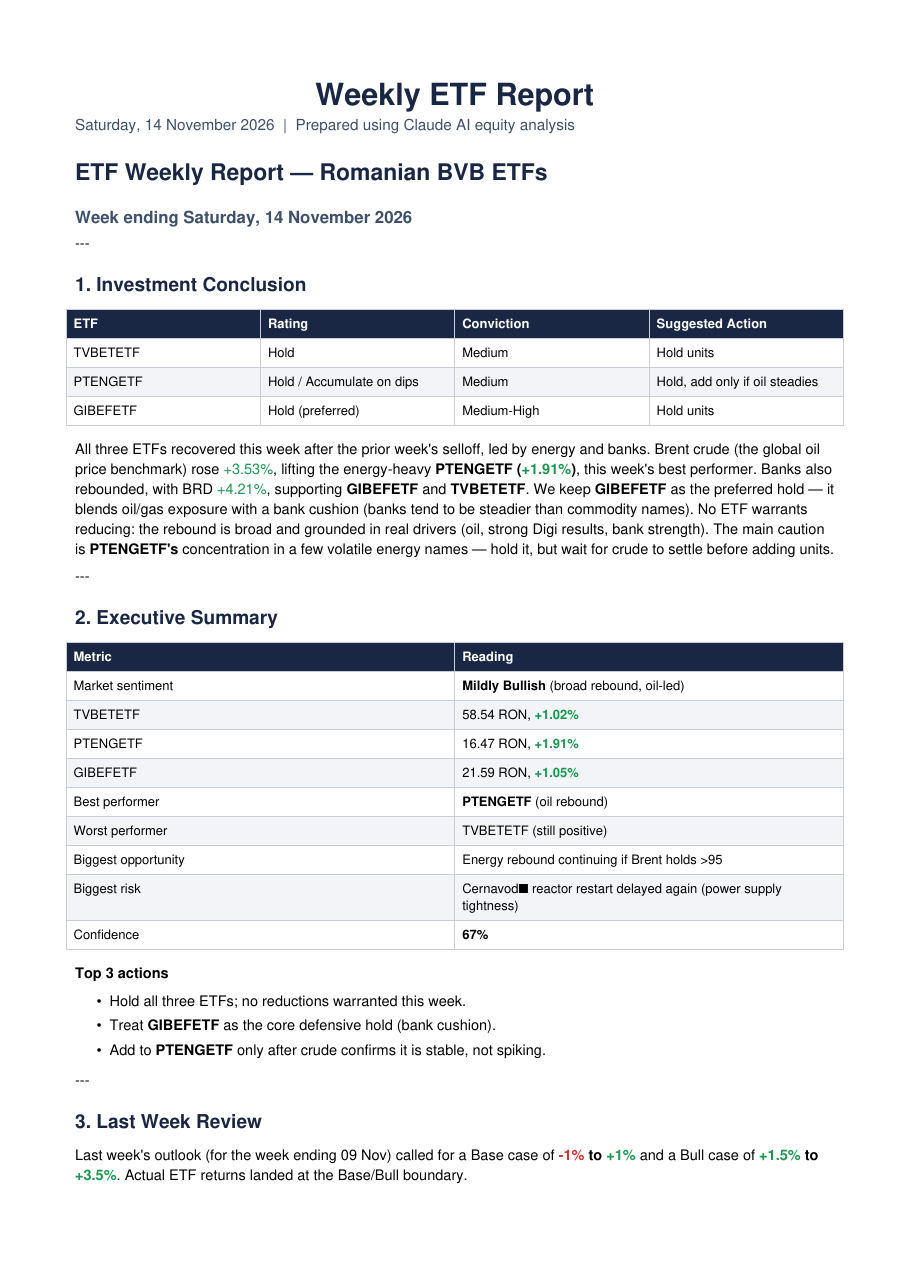
First page of the weekly ETF report

Open the full PDF · eleven sections, ten pages

The structure is written once, in the system prompt

The model is not asked for “a report” and left to choose a shape. The system prompt specifies eleven numbered sections and what belongs in each: the investment conclusion opens, because it is the first thing the reader should see; the outlook closes, because next week’s run has to read it back. The model returns Markdown against that contract, and reportlab draws it.

That is why the output is stable week to week without any parsing or validation code — the format is an instruction, not a post-processing step.

Section 3 is the loop closing

Every report opens its third section by grading the previous one. This is from the 14 November edition, marking the predictions made on 9 November — including the one that was wrong.

3. Last Week Review

Prediction                              Outcome                            Verdict

"Oil-driven setback, not a market       Market rebounded this week;        Correct
 breakdown"                             oil +3.5%

Base case -1% to +1%                    All ETFs +1.0% to +1.9%            Slightly beat

Froth (RRC/PTR) keeps unwinding         RRC rebounded +44.59%              Wrong

Honest miss: We expected Rompetrol Rafinare (RRC) froth to keep deflating;
instead it staged a violent meme-stock bounce.

Nothing in the pipeline can fake this. The predictions were written a week earlier and stored before the outcomes existed.

The model is not asked to decide what a report should contain. Each section is specified in the system prompt with its own job, its own table columns and its own word limit, and the material for it comes from a named part of the user message. What the model supplies is the reading — the structure is not its decision.

SectionWhat it isWhat it is built from
1Investment ConclusionRating, conviction and suggested action per fund, then a summary of at most 150 words.This week's fund prices. Specified to come first, because it is what the reader opens the PDF for.
2Executive SummaryA dashboard: sentiment, weekly performance, best and worst, confidence as a percentage, top three actions.The delta summary. Required to be a compact table, not prose.
3Last Week ReviewGrades the previous report, prediction by prediction, and says plainly what it got wrong.previous_analysis.md, appended to the user message. Skipped entirely on a first run.
4ETF ComparisonWeekly return, outlook, risk and recommendation per fund, then three to five sentences on which is preferred.Fund-level prices and the week's sector moves.
5Performance DashboardSector table, best and worst holdings, and a heatmap of the major positions.The delta, per holding. Explicitly forbidden from repeating section 6.
6Individual Stock AnalysisOne block per changed holding in a fixed shape: price, move, what happened, catalysts, risks, recommendation. 120 words maximum.Only the holdings that changed. The thirty-odd that did not move are never described.
7Market RadarA scoreboard of last week's picks, then a new top ten with a concrete, falsifiable prediction for each.The ten screened companies outside the funds, plus the previous week's radar picks.
8Risk DashboardRisks sorted highest priority first, each with a timeframe, a potential impact and one recommended action.Everything above it. This is the model reasoning over its own report rather than over new data.
9Market DriversAt most five bullets explaining the week.Macro figures — Brent, EUR/RON, USD/RON — and the filings. Required to be grounded in provided data only.
10What to WatchForward-looking dates pulled out of this week's filings: shareholder meetings, dividend dates, earnings.The filings themselves. If no dates exist, it gives three signals to monitor instead.
11OutlookBull, base and bear case, each with a probability and an expected return.The model's judgement — and the section that section 3 will grade next Friday.

Two of the eleven are graded a week later. Section 11 writes the outlook that section 3 marks next Friday, and section 7 scores its own previous picks. That is the whole feedback loop, and it exists because the report is stored rather than sent.

Running unattended

Nobody is watching when this runs. The interesting engineering is in the ways it is allowed to fail.

Before anything

It starts itself

One report a week, on Friday. A launchd job fires on Friday at 20:00 and that is the run that produces it.

The same job also fires at every boot and login, but those invocations are not extra reports — they are checks. Each one asks a single question: has a report been written since the most recent Friday 20:00? Almost always the answer is yes and the script exits in milliseconds. The only time a boot fire produces anything is when the Friday was missed entirely because the laptop was switched off, which is the case it exists for.

<key>StartCalendarInterval</key>
<dict>
    <key>Weekday</key><integer>5</integer>   <!-- Friday -->
    <key>Hour</key><integer>20</integer>
</dict>
<key>RunAtLoad</key><true/>                  <!-- and on every boot -->

The log line this produces most often is Already have a report since Friday 20261113 20:00 - nothing to do.

Fail before overwriting something good

The runner aborts on the first failing command. The copy that publishes the PDF is the last line of the script, so a run that breaks halfway leaves last week’s report in place rather than replacing it with a broken one.

set -euo pipefail

./venv/bin/python weekly_etf_report.py

DEST="$HOME/Library/Mobile Documents/com~apple~CloudDocs/Stock Watcher Report"
mkdir -p "$DEST"
cp "reports/ETF_Report_$(date +%Y%m%d).pdf" "$DEST/"

Where the report ends up

It runs on a Mac, so the scheduler is launchd and the last thing the script does is copy the finished PDF into iCloud Drive. That one line is the entire delivery mechanism: the report appears in the Files app on the phone a few seconds later, with no app to build, no server to run and no notification system to maintain.

It is not the most elegant option. It is the one that put the report in a pocket every Friday without adding a second thing to keep alive.

Don’t run twice, don’t run early

Because the job also fires at every boot and login, it can be invoked many times a day. Before doing anything it works out when the most recent Friday 20:00 was, and compares that against the newest report on disk. If a report already covers this week it exits; if this week’s Friday has not happened yet it also exits. The scheduler is dumb on purpose — the script decides whether it is due.

today_dow=$(date +%u)                    # Mon=1 .. Sun=7
days_since_friday=$(( (today_dow - 5 + 7) % 7 ))
friday=$(date -v-${days_since_friday}d +%Y%m%d)
friday_2000=$(date -j -f "%Y%m%d %H:%M" "${friday} 20:00" +%s)

if (( now < friday_2000 )); then
    echo "This week's Friday 20:00 hasn't arrived yet - nothing to do."
    exit 0
fi

latest_mtime=$(stat -f %m reports/ETF_Report_*.pdf 2>/dev/null | sort -rn | head -1)
if [[ -n "$latest_mtime" ]] && (( latest_mtime >= friday_2000 )); then
    echo "Already have a report since Friday $friday 20:00 - nothing to do."
    exit 0
fi

Wait for the network to actually exist

A laptop waking from sleep runs the job before Wi-Fi reconnects, and every request fails with a DNS error. This cost several silent weeks. The fix is to probe the API endpoint until it answers, for up to three minutes, before starting.

# launchd can fire this the instant the Mac wakes from sleep, before Wi-Fi
# has reconnected - every network call then fails with a DNS error and no
# report is produced. Wait up to 3 minutes for a real connection first.
for i in $(seq 1 18); do
    curl -s -o /dev/null --max-time 5 https://api.anthropic.com && break
    sleep 10
done

Each fetch retries, then gives up quietly

A failed page returns None instead of raising. The stage carries on with whatever it collected, and the report says what is missing. One unreachable company does not cost the other twenty-five.

def _get(self, url: str, retry=2):
    for attempt in range(retry):
        try:
            response = requests.get(
                url, headers=self.headers, timeout=self.timeout, impersonate="chrome"
            )
            response.raise_for_status()
            return response
        except requests.exceptions.RequestException as e:
            logger.warning(f"Attempt {attempt + 1} failed for {url}: {e}")
            if attempt < retry - 1:
                time.sleep(2)
    return None

The key never enters the repository

The API key lives in a .env file loaded at import. It is excluded before the first commit rather than after — a key removed in a later commit is still in the history, and still has to be rotated.

# Secrets
.env
api.txt

git ls-files returns nothing matching env, key or secret.

What it costs

The design target is a hobby budget: about ten dollars a year.

Measured, over fifteen logged runs

Every response reports its own token usage, so this is read from the logs rather than estimated: an average of 18,600 input tokens and 7,000 output tokens per week. At Opus pricing that is about 27 cents a run, or roughly fourteen dollars a year — above the ten-dollar target, and the gap is entirely in output, which costs five times what input does.

Only what changed is sent

The largest saving is structural. The briefing is built from the delta, so a position that did not move and published nothing never appears in the prompt. In a normal week seven of forty-four positions are described; the other thirty-seven cost one line of summary between them.

for etf_name, changes in delta['changes_by_etf'].items():
    changed_stocks = changes.get('changed_stocks', [])
    if not changed_stocks:
        continue                      # unchanged positions are never sent

Noise is filtered before it becomes tokens

A move under 0.1% does not count as a change, so a day of rounding does not drag forty-four positions into the prompt. News is capped at five items per stock and each headline is cut to 160 characters — enough to say what happened, not enough to paste an article.

MAX_NEWS_PER_STOCK = 5

def _format_announcements(self, announcements: List[Dict]) -> str:
    txt = ""
    for ann in announcements[:MAX_NEWS_PER_STOCK]:
        tag = "[BVB]" if ann.get('source') == 'bvb' else "[News]"
        title = (ann.get('title') or '')[:160]

The style rules are a cost control

Output tokens are the expensive half, so the instructions that make the report readable are the same ones that make it affordable. Word limits per section, no repetition between sections, tables instead of prose: all of it was written for the reader and all of it shows up in the bill.

- Prioritize clarity over length. Avoid repeating information across sections.
- Never produce walls of text. Paragraphs under 4 lines. Bullets under 1 sentence.

Maximum 120 words per stock. Do not repeat info covered elsewhere.
Then a summary paragraph, maximum 150 words, explaining the recommendation.

Prompt caching, deliberately not used

The system prompt is large and identical week to week, which looks exactly like the case prompt caching is for. It is not. A cache write costs more than a plain input token, and the ephemeral cache expires in five minutes — so a job that runs once a week would pay the premium every time and never once read the cache back.

# No prompt caching: one API call per week and the ephemeral cache TTL
# is 5 minutes, so cache writes would expire unread (at a premium).

And one call, once a week

No conversation history and no retry loop around the model. The cheapest request is the one that is not made twice.

Built with